


Ask most executives where their biggest energy efficiency opportunity sits, and few point to the chilled water loop running under their buildings.
In the Gulf, that is exactly where it hides.
This area is one where cooling is the largest single load on the grid, and district cooling optimization is the highest-leverage move most operators still have not fully made.
At Apollo we see one repeating pattern clearly:
The infrastructure is world-class, but it runs well below its potential.
That’s why we decided to write a guide on district cooling optimization in the UAE. Here are my key takeaways:
- Cooling is the UAE’s largest electricity load, which makes district cooling optimization the highest-leverage efficiency move most operators can make.
- Low delta-T syndrome is the most common and costly leak: systems designed for ~10°C often run at 6-8°C, driving excess pumping and stranded capacity.
- Two numbers decide the outcome: kW/RT and system delta-T. High performers push kW/RT below 0.9 and hold delta-T near design.
- Regulation is now enforced. Dubai’s RSB and Abu Dhabi’s DoE license operators, regulate tariffs, and protect consumers.
- The UAE targets around 40% of cooling from district cooling by 2030 and a 40% cut in national energy demand by 2050.
What is district cooling optimization, and why does it matter now?
District cooling delivers chilled water from a central plant through insulated pipes to many buildings, instead of each building running its own chillers. It is far more efficient at scale.
District cooling optimization is the discipline of making that shared system perform as designed: maximising cooling delivered per unit of electricity, restoring lost capacity, and cutting waste across the plant, the network, and the buildings it serves.
It matters now because cooling demand is climbing, energy is a permanent cost pressure, and regulators have moved from encouragement to enforcement. According to the IEA’s analysis of space cooling, cooling is already close to half of peak electricity demand in hot regions and is set to be one of the fastest-growing loads worldwide.
Getting district cooling optimization right is now core to cost control and compliance.
A couple of district cooling optimization terms to keep in mind:
| Term | What it means |
|---|---|
| RT (refrigeration ton) | The unit of cooling capacity a plant or building is rated for. |
| RTh (ton-hour) | Cooling energy used over time. The basis of consumption billing. |
| kW/RT | Electricity used per ton of cooling. The core efficiency metric. |
| Delta-T (ΔT) | The temperature gap between chilled water supply and return. |
| TES | Thermal energy storage. Stores cooling to shift load off peak hours. |
| ETS | Energy transfer station, where the network hands cooling to a building. |
| Capacity vs consumption charge | A fixed charge for reserved RT versus a variable charge for RTh used. |
Why is the UAE the world’s district cooling capital?
Nowhere relies on cooling like the Gulf.
In Dubai, roughly 70% of electricity goes to air conditioning, and the UAE has built the densest district cooling market on earth. Empower alone runs more than 1.4 million RT of connected capacity across 1,400-plus buildings, while Tabreed anchors Abu Dhabi and beyond.
The scale is still growing. The UAE district cooling market was valued near USD 3.7 billion in 2025 and is projected to pass USD 6 billion by 2033.
Yet district cooling still meets under 20% of Dubai’s cooling demand today, against a national ambition to reach around 40% by 2030.
That gap is the opportunity.
As penetration rises, district cooling optimization becomes the difference between plants that scale profitably and plants that scale their inefficiency. It is also water-intensive, which raises the stakes further in a desalination-dependent region.
The same pressures are reshaping neighbouring markets, from Saudi Arabia’s giga-projects to Qatar’s growing cooling networks, and the lessons apply anywhere cooling dominates the load.
What sets the UAE apart is maturity: the assets, the data and the regulation are all further along, which makes it the clearest proving ground for district cooling optimization at scale.
Where does district cooling lose energy and money?
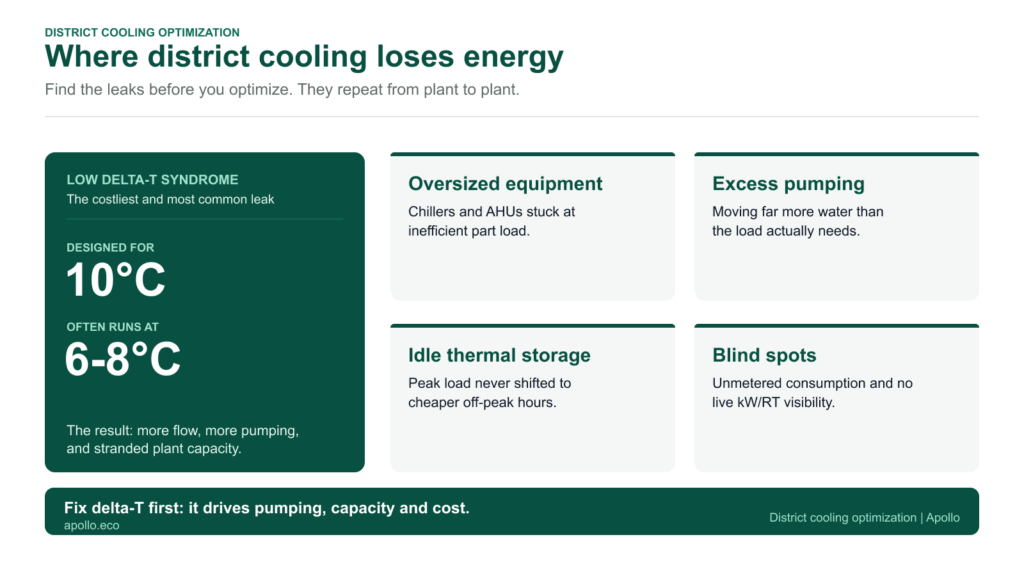
Before you optimize anything, you have to find the leaks. In my experience the losses are remarkably consistent from plant to plant, and most trace back to one culprit: low delta-T syndrome.
A district cooling system is designed for a wide temperature spread between supply and return, typically around 10°C. In the field, real systems often run a delta-T of only 6 to 8°C. That collapse forces more chilled water through the network to deliver the same cooling, which drives up pumping energy, strands plant capacity, and quietly inflates every bill.
Oversized air handling units, faulty control valves, and part-load chiller inefficiency compound it. Idle thermal storage and unmonitored consumption do the rest. I have walked into plants running a delta-T of 5°C, moving nearly double the water they should, with operators convinced the chillers were to blame.
They were not. The network was.
District cooling optimization is, at its heart, the work of closing these gaps.
Which metrics prove your district cooling optimization is working?
You cannot manage what you do not measure, and district cooling optimization lives or dies on a handful of numbers.
These are the ones I put in front of every operator and every CFO.
| Metrik | What it measures | What good looks like |
|---|---|---|
| kW/RT | Plant electrical efficiency | Lower is better; high performers push below 0.9 |
| System ΔT | Supply-to-return temperature spread | Close to design (~10°C); low ΔT signals waste |
| Pumping energy | Power to move chilled water | Falls sharply once ΔT is restored |
| TES utilization | Peak load shifted off peak | Higher use cuts peak demand and cost |
| Water per RTh | Water intensity of cooling | Lower protects both cost and sustainability |
The single most useful habit is watching these numbers continuously and benchmarking one plant against another.
A plant that looks acceptable on a monthly average can be bleeding energy at two in the afternoon, and only live data catches it. That is the difference between reporting your performance and actually managing it, and it is where most district cooling optimization programs either succeed or quietly stall.
Who regulates district cooling in the UAE, and what is required?
Optimization is now a compliance issue, not only an engineering one, and the direction of travel across the Gulf is toward tighter oversight, transparent tariffs, and protected consumers.
In the UAE the rules are already concrete, and they differ by emirate.
| Jurisdiction | Regulator & key instruments | What it means for you |
|---|---|---|
| Dubai | RSB: Executive Council Resolution (6) of 2021; RD10 tariff regulation; Resolution 87 of 2025 (updated fees and fines). | Operators and billing providers need an RSB permit. Tariffs are regulated and must be transparent. |
| Abu Dhabi | DoE: Law No. 11 of 2018; District Cooling Regulation (in force since 2019); water management policy. | Licensing, technical performance standards, price regulation, and consumer protection all apply. |
| National | UAE Energy Strategy 2050; National Energy & Water Demand Management Programme. | A 40% cut in energy demand, with district cooling penetration and building retrofit targets to 2030. |
How do you build a district cooling optimization plan?
A district cooling optimization plan is a loop, not a one-off project.
This is the sequence I take operators through, and it works whether you run a single plant or a national portfolio.
District cooling optimization
A six-step optimization plan
What does district cooling optimization deliver for the business?
For a CFO, district cooling optimization is one of the rare efficiency plays with a fast, measurable return.
Restoring delta-T and right-sizing plant operation cuts electricity and pumping cost immediately, defers capital spend by freeing stranded capacity, and lowers water use in a region where that carries real cost. It also de-risks the balance sheet: regulated tariffs, billing scrutiny and reporting obligations all reward operators who can prove their numbers.
And because cooling drives the bulk of Scope 2 emissions here, the same data feeds your sustainability reporting. Efficiency, compliance and ESG converge on one dataset.
In practice, the first wins usually come from control and commissioning rather than new capital equipment, which is why the payback on district cooling optimization tends to be measured in months, not years.
How Apollo supports district cooling optimization
Every step above runs on the same foundation: granular, continuous, trustworthy data.
That is what Apollo is built to provide.
- Optiwise monitors kW/RT and delta-T in real time, benchmarks plants and flags anomalies before they show up on a bill.
- Finwise tracks cost and validates capacity and consumption charges.
- Ecowise turns that energy data into audit-ready Scope 1, 2 and 3 emissions.
Sıkça sorulan sorular
What is district cooling optimization?
District cooling optimization is the practice of making a centralized chilled-water system deliver the most cooling for the least electricity and water, by restoring design delta-T, tuning the plant, using thermal storage, and monitoring performance continuously.
What is a good kW/RT for a district cooling plant?
Lower is better. Legacy plants can sit above 1.2 kW/RT, while well-optimized modern plants push below 0.9 kW/RT across the load range. The trend over time matters more than any single reading.
Why does low delta-T matter so much?
When the supply-to-return temperature spread falls below design, the system must pump far more water to deliver the same cooling. That wastes pumping energy and strands plant capacity, which is why delta-T is the first target of any district cooling optimization effort.
Who regulates district cooling in the UAE?
In Dubai it is the RSB, in Abu Dhabi it is the Department of Energy, and the federal UAE Energy Strategy 2050 sets national demand-reduction and cooling targets. Operators need the relevant permits and must meet technical and tariff rules.
What is the UAE’s district cooling target for 2030?
Dubai aims for district cooling to meet around 40% of its cooling demand by 2030, up from under 20% today, alongside wide-reaching building-retrofit goals. Nationally, the UAE Energy Strategy 2050 targets a 40% reduction in total energy demand, which makes district cooling optimization central to hitting those numbers.