



A retailer once showed me a ranking of their worst stores.
It was a clean spreadsheet.
Every site in the estate, sorted by kilowatt-hours, worst at the top. Someone had done real work to build it, and the plan was to send the engineering team down the list from number one.
The problem was that the list was mostly a list of their biggest stores.
I’ve seen that same spreadsheet in a dozen companies now, and it’s why I keep saying total kWh is a vanity metric. It tells you how much building you own. It tells you almost nothing about how well you run it.
Energy use intensity is the fix, and in GCC retail and F&B it takes a bit more care than most guides admit. So let’s get into what it is, what good looks like, and where it stops working.
- Total kWh measures building size, not performance. Rank an estate on it and the list is mostly a list of your biggest stores.
- Energy use intensity, usually kWh per square meter, is the fix. But it only works inside a segment.
- Format drives the spread. In our data supermarkets run 40 to 60 kWh/m² a month and fashion retail in a mild month sits at 12 to 18. Borrow the ratio, measure your own level.
- For F&B, floor area is the wrong denominator. Kitchen load follows throughput, so use energy per order or per cover.
- In the Gulf, cooling is most of the load, so without degree-day normalization your comparison mostly measures the weather.
What is energy use intensity, and why does it beat total kWh?
Energy use intensity, usually shortened to EUI and defined by ENERGY STAR as energy use per unit of floor area, is energy consumed divided by something that describes the size or output of the site. For buildings that’s normally kWh per square meter, measured over a month or a year.
That one division changes what you’re measuring. Total kWh answers “how big is this?”
Energy use intensity answers “how hard is this site working for every square meter it occupies?”
Which is the question you actually wanted answered.
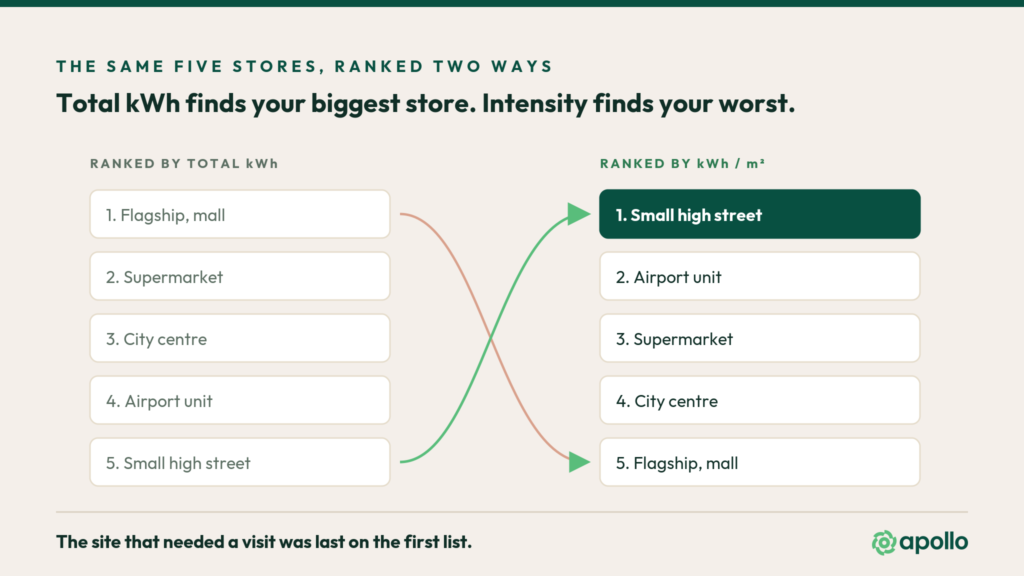
Here’s what it does to a ranking.
Your flagship store will almost always top a list sorted by total consumption, because it’s four times the floor area of everything else. Divide by square meters and it often drops to the middle of the pack, while a small unit nobody had looked at climbs to the top.
That reshuffling is the entire value of an energy intensity benchmark. The engineering visit that was going to your flagship now goes somewhere it will find something.
Why is total kWh such a persistent trap?
Because it’s the number the invoice gives you, and it takes no effort.
Every utility bill in the world reports total consumption.
Nobody’s bill tells you your intensity, because the utility doesn’t know your floor area. Published references exist, and Energy Star maintains national median tables by property type, but somebody has to go and look them up.
So the metric that takes no work is the one that ends up shown to the board, which then it sets the agenda for a year.
The second reason is that it feels fair.
Ranking by total kWh looks objective, and it’s easy to defend in a meeting. Ranking by intensity requires you to have decided on a denominator, and that decision is arguable, which makes people nervous.
My view after enough of these projects: an arguable number that points at the right site beats an unarguable number that points at the wrong one.
What’s a realistic energy use intensity benchmark for retail?
It depends almost entirely on format, and the spread is wider than people expect.
Let me start with a warning here:
The figures I’m about to give you come from estates I’ve worked in, most of them outside the Gulf. Don’t lift them as GCC targets. Climate, building stock, trading hours and refrigeration standards all move the level, and a 45°C summer moves it up.
What travels between markets is the shape.
In my data a supermarket typically runs somewhere between 40 and 60 kWh/m² a month, because refrigeration never stops. Fashion retail in a mild month can sit at 12 to 18. That’s a three or four times gap between two things both called “a shop,” and a gap that size turns up in every market I’ve looked at.
The absolute numbers move but the ratio between formats often holds.
| Format | What drives the load | How to measure it |
|---|---|---|
| Supermarket | Refrigeration, running continuously | kWh/m², typically 40 to 60 a month in our data |
| Cold storage | Cooled volume, not floor area | kWh per cooled m³ |
| Cosmetics and specialty retail | Display lighting and cooling | kWh/m², above apparel and below food retail |
| Fashion retail | Cooling and lighting | kWh/m², 12 to 18 in a mild month |
| F&B and QSR | Throughput, not footprint | kWh per order or per cover |
| Dry warehousing | Lighting and handling equipment | kWh/m², but check whether it is climate controlled |
Across Apollo’s own benchmark pool, which covers more than 20,000 facilities, the spread between the most and least intensive retail formats runs to several times over. That is the pattern worth borrowing: not the numbers themselves, but the fact that a single retail average is hiding a range this wide.
The level is yours to measure.
Which leads to the single most common mistake I see: Somebody builds one intensity benchmark for the whole estate, compares a supermarket to a fashion unit, and concludes the supermarket is a disaster.
It isn’t. It’s a supermarket.
Segment first, then rank inside the segment. Nothing else in this article matters as much as that sentence.
Why does energy use intensity break down for F&B?
Because a restaurant’s energy has very little to do with its floor area.
The US Energy Information Administration found that food service buildings are nearly four times more energy intensive than the average commercial building, at 263 versus 70 thousand Btu per square foot. And 40% of that goes to cooking, with refrigeration second. Neither of those follows floor area.
Two coffee shops of identical size can consume completely different amounts depending on how many drinks they make.
A kitchen’s load follows covers, not carpet.
And a delivery-heavy site can run a huge kitchen load out of a tiny footprint, which makes its kWh/m² look catastrophic when the site is actually productive.
I’ve watched an F&B operator flag a small high-volume unit as their worst performer on intensity, when what they’d actually found was their busiest store.
So for F&B, square meters are the wrong denominator. You need output.
What is energy per order, and when should you use it?
Energy per order is exactly what it sounds like: kilowatt-hours divided by the number of orders, covers or transactions in the same period.
It’s the right metric whenever throughput drives the load rather than area. Quick service, delivery kitchens, coffee, anything where the equipment turns on because a customer bought something.
Two things to know before you start.
→ There’s no public benchmark for this. Nobody has published a credible kWh-per-order figure by cuisine or format, and anybody who quotes you one is guessing. So you build your own from your own estate, which is fine, because internal comparison is where the money is anyway.
→ Your POS system already has the denominator. This is the part operators find surprising. You don’t need new hardware to start measuring energy per order. You need your interval consumption data and your transaction count in the same table, matched by site and by hour.
Do that for a month across ten sites and you’ll have a benchmark nobody else in your market has.
How does the Gulf climate distort energy use intensity?
More than anywhere I’ve worked.
In the UAE, cooling accounts for the large majority of what a building consumes. Estimates put it at 60 to 70% of electricity use, with many systems oversized by a quarter or more. So a big share of any intensity figure you calculate here is really a reading of the weather.
Three consequences follow:
- Comparing this July to last July tells you about two summers, not about your operation.
- Comparing a Dubai store to a Riyadh store compares two climates, and
- Comparing any Gulf month to the month before it mostly measures the outdoor temperature.
The fix is degree-day normalization, which sounds technical and isn’t.
You divide the cooling-related portion of consumption by cooling degree days for that period and location, so a hot month and a mild month become comparable. It’s the same approach ASHRAE Guideline 14 and the IPMVP protocol use to verify savings, so it holds up in an audit.
Most Gulf operators know this intuitively. Almost none of them do it in the numbers they actually circulate.
| Variable | What happens if you ignore it | How to handle it |
|---|---|---|
| Climate | Your comparison measures the weather | Divide cooling load by cooling degree days for that site and period |
| Format | Supermarkets always look like failures | Segment first, rank inside the segment |
| Mall or street | Mall units win every month for free | Treat them as separate benchmark groups |
| Operating hours | A 24-hour site looks wasteful against a 10-hour one | Normalize per operating hour, or compare like schedules |
| Metered or allocated | You are benchmarking somebody’s estimate | Flag allocated sites and exclude them from rankings |
How do you compare a mall unit to a high-street store?
Carefully, because they’re not the same building even when they’re the same brand.
Here’s a pairing from our own data that surprises people. Same apparel brand, same fit-out, roughly the same footprint. On kWh per square meter the street unit came in at 17.4 and the mall unit at 13.4, a gap of nearly a third.
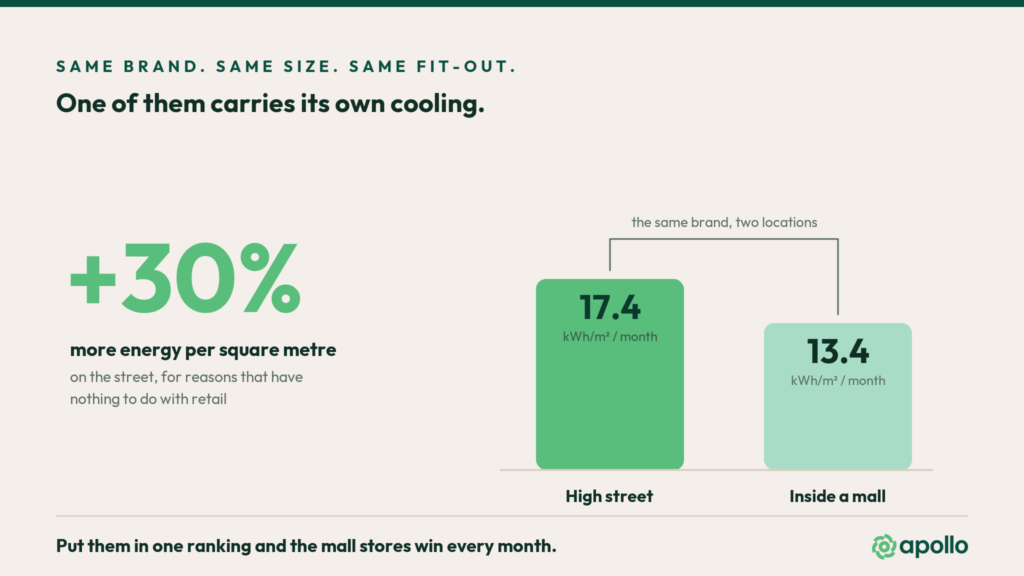
Nothing about how those two shops are run explains the gap. One of them owns its cooling plant and has a glass front and a door opening onto hot outside air. The other is a box inside a building somebody else keeps cold.
And again, treat 17.4 as an illustration rather than a target.
Those readings aren’t from the Gulf, and if anything I’d expect the gap to be wider here, because what drives it is the temperature difference across the facade. The number you need is the one from your own two stores.
So if your estate mixes formats, and in the Gulf almost every estate does, mall and street have to be separate benchmark groups. Put them in one list and the mall stores will look like your top performers every single month, for reasons that have nothing to do with performance.
The same logic applies to a unit where the landlord bills you an allocated share rather than a metered figure.
That isn’t a real benchmark, at least not the type you need.
Which denominator should you actually use?
Match the denominator to whatever drives the load. kWh per square meter is the default, not the answer.
If floor area drives it, use per square meter. If throughput drives it, use per order or per cover. If trade drives it, use per unit of revenue. If cooled volume drives it, as in cold storage, use that.
And you can run more than one; a supermarket is usefully measured per square meter for its cooling and lighting, and per revenue for its refrigeration, because those two loads answer to different things.
The test I use: if a site’s number moves and you can’t say which real-world thing moved it, you picked the wrong denominator.
How do you build an energy use intensity benchmark you can trust?
Energy use intensity
Six steps to a benchmark you can defend
The step people skip is the second one. Floor area records in most estates are old, inconsistent, and sometimes describe a store that was refitted three years ago. An intensity benchmark built on bad square meters is worse than no benchmark, because it’s confidently wrong.
What does better benchmarking actually deliver?
1- Engineering time that finds something
Your site visits go to the genuine outliers instead of the biggest buildings, so the same number of visits turns up more.
2- A defensible target
“Reduce kWh/m² by 8% in the apparel segment” is a target somebody can own.
“Use less energy” isn’t.
3- Faster payback on what you already fixed
Once you know a segment’s normal range, a site drifting out of it shows up in weeks instead of at the annual review.
4- Reporting that reconciles
The same normalized dataset feeds your Scope 2 figure, so cost and carbon stop disagreeing with each other.
How does Apollo build energy use intensity benchmarks?
Three things have to be true before an intensity benchmark is useful, and all three are usually where it falls apart.
You need interval consumption per site rather than a monthly invoice total.
You need clean site attributes: floor area, format, mall or street, operating hours, and climate zone.
And you need a comparison set that reaches beyond your own estate, because if every store you own is 20% inefficient, your best store still looks like a winner.
→ Optiwise handles all three. It normalises for climate and format, segments the estate automatically, and compares each site against genuinely similar operations rather than against your own average.
→ Finwise attaches cost to those numbers so an intensity outlier turns into a dirham figure.
→ Ecowise uses the same normalized data for Scope 1, 2 and 3 reporting.
These days I’ve stopped asking operators which site is their worst. I ask what their list is sorted by.
The answer to this usually explains why last year’s efficiency program found nothing.
Let’s talk.
Frequently asked questions
What is energy use intensity?
Energy use intensity, or EUI, is energy consumption divided by a measure of size or output, most often kilowatt-hours per square meter per month or per year. It answers how hard a site works for its size, which total consumption cannot tell you.
What is a good energy use intensity for a retail store?
It depends on format more than anything else. Supermarkets often run 40 to 60 kWh/m² a month because refrigeration runs constantly, while fashion retail in a mild month can sit at 12 to 18. Comparing across formats is the most common benchmarking error.
Why is total kWh a bad way to compare stores?
Because it measures building size rather than efficiency. Rank an estate on total consumption and the list is largely a list of your largest sites, so effort goes to big stores that may already be performing well while smaller wasteful sites never surface.
How do you measure energy efficiency in a restaurant?
Use output rather than area. Energy per order, per cover or per transaction reflects the fact that kitchen load follows throughput, not floor space. You can build this from interval consumption data and POS transaction counts matched by site and hour.
How does climate affect energy use intensity in the Gulf?
Heavily, because more than 70% of UAE building energy goes to cooling. Without degree-day normalization, month-to-month and site-to-site intensity comparisons largely measure outdoor temperature rather than how well each site is operated.