



Almost every European enterprise we meet is doing multi-site energy benchmarking in Excel.
Which makes sense. It’s how these programs start, and for the first dozen sites the spreadsheet is the right tool. Somebody builds a tab per site, pulls the monthly invoices in, adds a column for floor area, and suddenly the estate can be compared.
Then the portfolio reaches forty sites, then a hundred and then someone asks for half-hourly data instead of monthly totals. Someone else asks why Milan looks worse than Rotterdam in August.
And the thing stops working, without ever saying so.
It never throws an error and that’s the problem. It keeps producing numbers, the numbers keep looking plausible, and nobody can tell you which ones are wrong.
So today, let’s take a deep look at how multi-site energy benchmarking works and how it can be better.
- Spreadsheets don’t fail loudly. They keep producing plausible numbers nobody can verify.
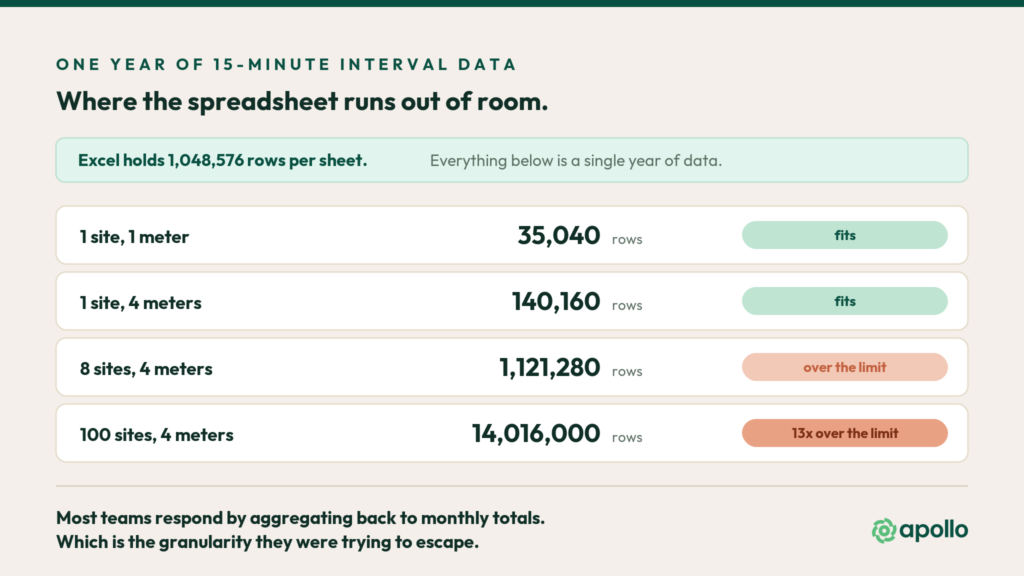
- One meter at 15-minute intervals produces 35,040 rows a year. Around the eighth site you have filled an Excel sheet, so teams aggregate back to monthly totals.
- Audit research found errors in about 94% of operational spreadsheets. In a benchmark, a wrong cell just looks like a site that needs a visit.
- Normalization is the real failure point. Climate, floor area, hours and building type have to be reapplied every period, forever.
- Under EU Directive 2023/1791, enterprises above 85 TJ need a certified EnMS by 11 October 2027. A defensible baseline is a benchmarking output.
What is multi-site energy benchmarking?
Multi-site energy benchmarking is the practice of comparing energy performance across a portfolio of buildings on a like-for-like basis, so you can tell which sites are genuinely underperforming rather than which ones are simply largest or hottest.
It has three parts, and each one is where a different thing breaks.
- Collection: getting consumption data out of every meter, supplier and portal in the estate.
- Normalization: adjusting for the things that differ between sites but say nothing about performance, like climate, floor area, opening hours and building type.
- Comparison: ranking what’s left and acting on the outliers.
Most estates manage the first part and stall somewhere in the second. Which is why multi-site energy benchmarking so often produces a report nobody trusts enough to act on.
Why do spreadsheets break at multi-site scale?
They break for three reasons, and only one of them is about size.
All three arrive after multi-site energy benchmarking has become something people rely on, which is what makes them expensive.
The volume argument is real but it’s the least interesting one.
A single meter recording at fifteen-minute intervals produces 35,040 readings a year. Give a site four meters and that’s 140,160 rows. Excel’s hard limit is 1,048,576 rows per sheet, so somewhere around the eighth site you’ve filled a worksheet with a single year of interval data.
Most teams respond by aggregating to monthly totals, which fits comfortably but is the root of the problem.
The spreadsheet held, it just pushed you back to the granularity you were trying to escape.
The error argument is worse.
Decades of audit research by Raymond Panko found that about 94% of operational spreadsheets contained at least one error, with cell error rates averaging in the low single digits. Carelessness has little to do with it. People make small mistakes in a few percent of complex steps, and a spreadsheet preserves every one of them, then copies it down four hundred rows.
In a financial model a wrong cell eventually shows up as a number that can’t be true. In multi-site energy benchmarking, a wrong cell just looks like a site that needs a visit.
The third reason is the one that actually kills programs.
A spreadsheet has an owner. When that person changes role, the logic behind their normalization columns leaves with them. We’ve seen estates where nobody remaining could explain why one region had a correction factor applied and another didn’t.
What breaks first, and in what order?
There’s a fairly predictable sequence, and knowing where you are on it tells you how urgent the problem is.
| Stage | What it looks like | What you lose |
|---|---|---|
| 1. Granularity goes | Interval data gets aggregated to monthly totals to fit | Load shape, peaks, off-hours consumption |
| 2. Updates slip | The refresh moves from monthly to quarterly to on request | Any chance of catching drift while it is happening |
| 3. Normalization freezes | Climate and area factors stop being updated | Comparability between sites and between periods |
| 4. Ownership breaks | The person who built the logic changes role | The ability to explain why any number is what it is |
| 5. Trust goes | The report still circulates, but nobody acts on it | The program, in practice if not on paper |
If you recognize yourself in the last two rows, the spreadsheet stopped being a multi-site energy benchmarking tool a while ago. It’s now a reporting artifact describing a process nobody performs.
Why is normalization the hardest part to do by hand?
Because there are four or five adjustments, and every one of them needs data the spreadsheet doesn’t contain.
Climate is the obvious one.
A site in Madrid and a site in Hamburg have different weather, so raw consumption comparison mostly measures latitude. Correcting for it means pulling degree-day data per location per period and applying it only to the weather-sensitive portion of load. That’s a maintained data feed. Somebody has to keep it alive.
Then floor area, which is usually wrong somewhere in the estate.
Then operating hours, which differ by country and by site. Then building type, since comparing a distribution center to an office tells you nothing. Then whether the meter reading is real or estimated.
We covered how to choose the right denominator in our piece on energy use intensity for retail and F&B, and the logic holds for any portfolio.
Here’s the part that makes manual normalization a losing game:
Every one of those adjustments has to be reapplied every period, for every site, forever.
Does multi-site energy benchmarking matter for compliance, or just cost?
Both, and in Europe the compliance side now has dates attached.
Under the recast Energy Efficiency Directive, EU Directive 2023/1791, enterprises with average annual consumption above 85 TJ must have a certified energy management system in place by 11 October 2027, and those above 10 TJ must complete regular energy audits instead. Our ISO 50001 guide covers what certification involves.
The relevant point for benchmarking is what an EnMS actually asks of you.
It expects a defensible energy baseline, performance indicators tied to real output, and evidence that you’re tracking improvement over time. All three are benchmarking outputs.
So a European enterprise doing this properly gets the compliance evidence as a by-product.
What replaces the spreadsheet?
Three things have to change, and a dashboard bolted onto the same workbook delivers none of them.
Any system running multi-site energy benchmarking properly handles all three. Miss one and you’ve only moved the problem somewhere newer.
Automated collection. Data pulled from meters, supplier portals and building systems on a schedule, without anybody downloading a CSV. If a human has to fetch it, it will be late, and eventually it won’t happen at all.
Normalization that runs itself. Climate, area, hours and building type applied consistently every period, with the logic on screen where somebody can check it. When somebody asks why two sites are being compared the way they are, the system should answer.
A comparison set larger than your own estate. This is the one most tools skip. If every building you own is twenty percent inefficient, your best building still looks like a winner. You need to know what similar operations outside your portfolio actually achieve.
How do you move off spreadsheets without a six-month project?
Ask yourself these questions:
Where should you start with multi-site energy benchmarking?
Start narrow.
The instinct is to onboard the whole estate at once, and that turns a useful change into a program with a steering committee.
Pick one segment, ideally your most numerous building type, and one year of interval data. Get the normalization right for that group alone. That gives you multi-site energy benchmarking at a scale you can still verify by hand, which is exactly why you start there.
What does “normal” look like for European building stock?
It helps to know before you set targets.
The European Commission’s EU Building Stock Observatory publishes consumption and performance data by country, drawn from Eurostat and national statistics offices.
It won’t tell you how your sites compare to each other. It will tell you whether your whole sector is drifting, which is useful context before you decide what good looks like.
What proves the business case?
Compare the ranking your new segment produces against your current spreadsheet ranking.
That comparison is the entire business case. In most estates the two lists disagree substantially, and the disagreement is the money.
Once the segment works, the rest is repetition rather than invention.
What should you look for in a benchmarking system?
Four questions cut through most vendor conversations.
- Can it ingest interval data from my actual suppliers, in my actual countries, without manual export?
- Does it normalize for climate automatically, or is that still my job?
- Can it compare my sites against operations outside my own estate?
- When the auditor asks how a number was produced, can it show them?
Apollo can help you never need to answer these.
→ Optiwise was built around those four. It handles collection and normalization across multi-country portfolios, and it compares each site against Apollo’s benchmark pool of more than 20,000 facilities, which is the comparison your own estate can never give you.
→ Finwise attaches cost to the result, so an outlier becomes a euro figure a CFO can act on.
→ Ecowise uses the same normalized dataset for Scope 1, 2 and 3 reporting.
Done properly, multi-site energy benchmarking stops being a monthly reporting chore and becomes the thing that decides where your engineering budget goes.
Excel did exactly what it was built to do. The job just grew past it.
Let’s talk.
Frequently asked questions
What is multi-site energy benchmarking?
It is the practice of comparing energy performance across a portfolio of buildings on a like-for-like basis, after adjusting for climate, floor area, operating hours and building type. The goal is to find the sites that are genuinely underperforming, which are usually different from the biggest ones.
Why can’t you do multi-site energy benchmarking in Excel?
Three reasons. Interval data exceeds Excel’s row limit at a handful of sites, so teams aggregate back to monthly totals. Research has found errors in the overwhelming majority of operational spreadsheets. And the normalization logic lives with one person, so it leaves when they do. Each one degrades multi-site energy benchmarking without ever producing an obvious failure.
How much data does interval energy monitoring produce?
A single meter recording every fifteen minutes produces 35,040 readings per year. A site with four meters produces over 140,000. Across a hundred-site portfolio that is roughly 14 million rows a year, which is why manual handling stops being viable quickly.
What does the EU Energy Efficiency Directive require?
Under Directive 2023/1791, enterprises consuming more than 85 TJ on average annually must have a certified energy management system by 11 October 2027. Those above 10 TJ must carry out regular energy audits instead. Both require a defensible baseline and performance indicators.
How do you normalize energy data across different countries?
Adjust for climate using degree days specific to each location and period, then for floor area, operating hours and building type. Flag estimated meter readings separately from actual ones. Apply the same rules every period so the comparison holds over time.