Every electricity customer in Dubai already has a smart meter. DEWA’s own count, published in July 2025, was 1,202,411 smart electricity meters, covering 100% of customers.
So the data exists.
What most buildings don’t have is anything that reads it. The interval readings feed a monthly invoice, the invoice goes to finance, and a few weeks later finance asks facilities why the number went up.
Energy monitoring software is supposed to close that gap. There are plenty of products that say they do, and a lot of them were built for markets where cooling is a season. In the UAE it’s most of the bill.
→ What should energy monitoring software actually do in a UAE building, and how do you check it before you sign?
- Energy monitoring software turns meter and bill data into alerts, site comparisons and costs. In Dubai the data already exists: DEWA reports smart meters on 100% of customers.
- Cooling is about 60 to 70 percent of electricity use in UAE buildings, so software without weather normalization mostly reports the weather.
- The bill depends on the emirate. Dubai’s commercial tariff climbs through four bands, Abu Dhabi’s is flat, and district cooling adds a capacity charge that’s due whether you use the capacity or not.
- The best demo test uses your own data. Ask the software to find a problem you already know about, and to rebuild one of your bills.
- The record behind cost control is the one Federal Decree-Law No. 11 of 2024 expects you to report from, so cost and Scope 2 should come out of one system.
What is energy monitoring software?
Energy monitoring software collects consumption data from meters, submeters and bills, puts it on one timeline per site, and flags what looks wrong so a named person can act on it.
That last part is where products differ. Plenty of tools stop at a dashboard. A chart of last week’s load is nice to have, but nobody’s job is to stare at it.
The useful ones keep going and answer three questions for you. What changed? What did it cost? And who should look at it?
It also helps to separate it from the things it gets confused with. A building management system (BMS) controls equipment inside one building: chillers, air handlers, lighting schedules. Monitoring software sits above it, watches every site and every bill, and tells you which building needs attention. Most estates need both, and a good monitoring tool reads from the BMS where one exists.
Why does a UAE building need a different checklist?
Three things about this market change what the software has to do.
First, cooling is most of the load. Air conditioning accounts for about 60 to 70 percent of electricity consumption in UAE buildings, according to the Abu Dhabi Department of Energy. So consumption follows the temperature outside. Compare August with February and you’re mostly comparing the weather. An alert system that ignores temperature fires all through May and then misses real waste in December, when a building should be using far less than it is.
Second, the bill depends on the emirate. Dubai bills commercial customers on a slab tariff with four bands, and the top band is about 65 percent more expensive than the lowest. Abu Dhabi’s commercial rate is flat. A portfolio spread across emirates runs on more than one pricing logic at the same time, and a tool that applies one blended rate per kWh will get the money wrong. It gets it most wrong in Dubai, where waste is charged at whichever band you’ve climbed into by then. Our guide to energy costs in the UAE walks through the bill line by line.
Third, a lot of cooling isn’t on the electricity bill at all. Buildings on district cooling pay a consumption charge plus a capacity charge per refrigeration ton, reserved annually and payable whether you draw the capacity or not. Electricity-only monitoring never sees that line. If part of your estate buys chilled water, the district cooling side needs the same attention as the meter.
| UAE factor | What it does to your bill | What the software has to do |
|---|---|---|
| Cooling at 60 to 70% of building electricity | Consumption follows the outdoor temperature | Normalize for cooling degree days before comparing sites or raising alerts |
| Dubai slab tariff, four commercial bands | Each extra kWh is charged at the highest band reached that month | Model the bands per account and show when in the month each one is crossed |
| Abu Dhabi flat commercial rate | Cost moves in step with consumption | Keep tariffs per account, with no blended rate across emirates |
| District cooling | A fixed charge per refrigeration ton, plus consumption | Track contracted capacity against actual peak draw |
| Smart meters on every Dubai connection | Interval data already exists | Work from interval data, with monthly invoices as the cross-check |
| Federal Decree-Law No. 11 of 2024 | Emissions have to be measured and reported | Produce Scope 2 from the same record, with the emission factor shown |
Where should the data come from?
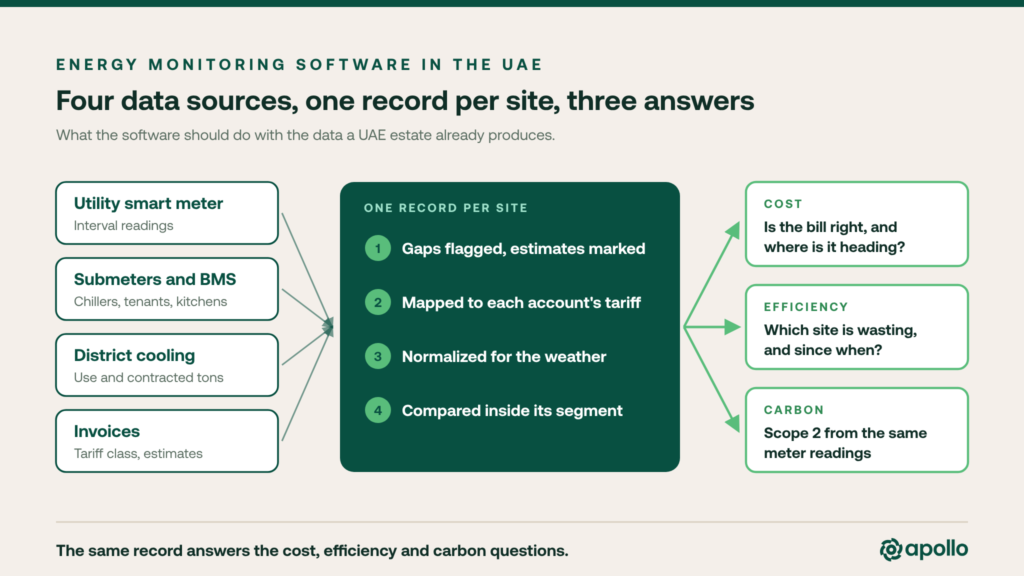
Usually from four places. Ask a vendor how each one gets in, and how often.
The utility meter. In Dubai it’s already smart. What your account can export from it, and at what resolution, is something to check with DEWA before you design anything around it.
Your own submeters and BMS. This is where the detail lives: chillers, tenant splits, kitchens, back-of-house.
District cooling statements. Consumption and contracted capacity, side by side.
Invoices. Even a PDF bill tells you the tariff class, whether the reading was estimated, and what was charged. It’s also the fastest way to build a first baseline while the interval data is being connected.
Resolution matters more than people expect. Hourly data is the floor. Monthly totals can’t show you what a building does overnight, and that’s where a lot of the waste sits.
Ask what happens when a meter drops out for two days, too. Good software flags the gap and tells you which numbers are estimated. Weak software draws a flat line through it and lets you find out at month end.
And in mall retail, ask whether each site’s consumption comes from a meter or from an allocation. An allocated figure is someone else’s estimate, and you can’t benchmark an estimate.
What should you look for in energy monitoring software?
Here’s the short list we’d take into any evaluation.
Energy monitoring software
Eight things to check before you buy
Two of these need more than a line.
Alerts are only as good as the person who gets them. In the estates we work with, the alerts that get acted on are specific and few: a store drawing its daytime load after closing, a baseload that has crept up for three weeks, a site that has left its segment’s normal range. They go to the site or regional owner with the cost attached. An inbox that receives forty notifications a day gets a filter rule by the second week.
Savings need a baseline you can defend. “This month against the same month last year” includes the weather, the opening hours, and whatever else changed. The standard way to do it is measurement and verification under the IPMVP, which adjusts the baseline for conditions before it claims a result. You don’t need to run that method yourself. You do need the software to show its working when it tells you something saved money.
How do you test energy monitoring software in a demo?
Bring your own data. A vendor’s demo estate is always clean, and every product looks good on a clean estate.
So, three tests.
Give it a problem you already know about. Hand over a few months of interval data for a handful of sites, including one where you know something’s wrong. Don’t say which. See whether it finds it, and how long that takes.
Ask it to rebuild one of your bills. Pick a Dubai account and ask the software to reproduce last month’s charge from the meter data. If it can’t get close, every cost figure it shows you elsewhere is a guess.
Ask how it calculated a saving. If the answer is a year-on-year comparison with no adjustment for temperature, you’ve learned what you needed to.
Then the practical questions. Who sets up the tariffs and the site details, you or them? How long until the first useful alert? Where is the data hosted, and does that fit your own IT and data policies? And what happens to your data if you leave?
What are the warning signs?
Most of them show up in the first demo, if you know what to listen for.
| What you hear in the demo | What it usually means | What to ask |
|---|---|---|
| A polished tour on demo data | You haven’t seen it handle a messy estate | Ask to run it on a sample of your own sites |
| Savings shown against last year | Weather and opening hours are still in the number | Ask for the adjusted baseline and the method |
| One cost per kWh across the portfolio | Tariffs aren’t modeled per account | Ask it to rebuild a Dubai bill from meter data |
| Dashboards building by building | There’s no portfolio view | Ask for a ranking of your sites inside one segment |
| Carbon as a separate module with its own upload | Two datasets that will drift apart | Ask whether Scope 2 comes from the same meter record |
What does energy monitoring software deliver, and how fast?
In the estates we work with, the first savings almost always come from how buildings are run. Closed-hours load, setpoints, start-up schedules. None of it needs a capital budget, which is why it shows up first. Equipment comes later.
For a sense of scale, here’s our own number. Across 166 facilities where we verified the result at a 90 percent confidence level between 2023 and 2025, the median improvement was 9.4 percent against each site’s own baseline (data cut September 16, 2026). Those estates are outside the Gulf, mostly in Türkiye, so it’s a pattern to test, and you shouldn’t read it as a UAE forecast. Cooling makes up a bigger share of the load here. That cuts both ways: more to gain from getting it right, and more noise to filter out first.
The other return is that you stop running the same data through three projects. The consumption record that drives cost control is the one you’ll need for emissions reporting. Federal Decree-Law No. 11 of 2024 has been in force since May 30, 2025. It puts a legal duty on companies, on the mainland and in free zones, to measure and report their greenhouse gas emissions. For most commercial operators, the largest piece of that is Scope 2, which is purchased electricity, which in this climate is mostly cooling. Our guide to the UAE Climate Law covers who reports and when.
And demand reduction is already public policy. Dubai’s Demand Side Management Strategy targets a 30 percent cut in electricity and water demand by 2030 against a 2013 baseline. Software that can show a measured reduction puts you on the right side of that conversation.
How does Apollo approach energy monitoring?
Apollo is built around the questions above, in three modules that share one consumption record.
→ Optiwise finds the waste. Closed-hours load, creeping baseloads, sites that leave their segment’s normal range, with weather normalization built in and comparisons drawn from a benchmark pool of more than twenty thousand facilities.
→ Finwise maps consumption to each account’s real tariff. Where you are in the slab this month, what the invoice should say, and what month end will look like before it arrives.
→ Ecowise turns the same record into Scope 1, 2 and 3 figures you can trace back to the original meter reading.
Software won’t reset a setpoint for you. Somebody on site still has to walk over and do it. What it can do is put the right building in front of that person while there’s still time to make a difference this month.
Let’s talk.
Frequently asked questions
What is energy monitoring software?
Energy monitoring software collects consumption data from utility meters, submeters, building management systems and bills, puts it on one timeline per site, and flags unusual consumption so someone can act on it. Better tools also map consumption to the tariff, compare sites fairly, and measure savings against a baseline.
What should energy monitoring software do in the UAE?
It should read interval data at hourly resolution or better, model each emirate’s tariff (Dubai’s commercial slab tariff differs from Abu Dhabi’s flat rate), track district cooling capacity charges, and normalize for weather, since cooling makes up about 60 to 70 percent of electricity consumption in UAE buildings. It should also produce Scope 2 figures from the same data.
Do I need new meters to use energy monitoring software in the UAE?
Usually not to get started. DEWA reports smart meters for 100% of its customers in Dubai, and utility invoices can build a first baseline. Submeters add detail where you need it, for example on chillers, kitchens or tenant splits, and many buildings already have a BMS the software can read from.
What is the difference between energy monitoring software and a BMS?
A building management system controls equipment inside one building, such as chillers, air handling and lighting schedules. Energy monitoring software sits above it, watches consumption and cost across every site and bill, and tells you which building needs attention. Most multi-site estates use both, with the monitoring software reading data from the BMS.
How do you measure savings from energy monitoring software?
Against an adjusted baseline. A simple year-on-year comparison includes weather, opening hours and other changes, which in the UAE can hide or invent a saving. The accepted method is measurement and verification under the IPMVP, which adjusts the baseline for conditions such as temperature before a saving is claimed.