

In the first two parts of the #RetailEnergyBreakdown series, we uncovered a critical truth:
Retailers don’t lack energy data. They lack clarity.
- In Part 1, we showed how inefficiencies remain invisible across store networks.
→ Read Part #1: The Invisible Energy Management Challenge Every Chain Retailer Shares
- In Part 2, we explained why most energy data fails; and how segmentation, normalization, and benchmarking reveal where improvement is actually possible.
→ Read Part #2: Why Most Retail Energy Data Leads Nowhere And What Meaningful Analysis Actually Requires
But insight alone doesn’t create results.
This third part focuses on what actually drives energy performance: how store-level behavior turns visibility into measurable savings; often without any capital investment.
Where Energy Savings Actually Happen
In Part 2, we established that up to 25% annual energy savings are achievable in targeted facilities once you have the right segmentation, the right benchmarks, and the right analysis in place. And we noted something that tends to surprise people: up to 15% of that does not require any capital investment at all.
That number comes from people.
Not equipment upgrades. Not infrastructure overhauls. Not new contracts or tariff switches. The single most underleveraged energy efficiency lever in retail chains is how employees operate the stores they work in every day.
The Gap That Equipment Cannot Explain
Take two stores. Same format. Same size. Same climate zone. Same equipment age and specification. One consistently runs 20 to 30% higher energy consumption than the other.
This is not a hypothetical. It shows up repeatedly across retail portfolios once you have the visibility to see it. And when you dig into what drives that gap, the answer is almost never the building or the machinery. It is the daily decisions made by the people inside it.
Everyday Actions That Drive Energy Waste
Small, routine decisions create significant impact:
- Lights left on in non-customer areas
- HVAC running with doors open
- Refrigeration issues left unreported
- Display lighting active overnight
- Incorrect temperature setpoints
- Equipment left on standby unnecessarily
None of these require an engineer to fix. They require awareness, habit, and accountability.
Why Store Employees Are the Biggest Energy Efficiency Factor
Energy management in retail has historically been treated as a technical function. It sits with facility managers, energy teams, or procurement. The people who actually operate the stores every day; store managers, floor staff, opening and closing shift leads are rarely part of the conversation.
The Visibility Problem
The consequence is a structural disconnect. The people with the most direct influence over daily consumption are the ones with the least visibility into it. They do not see the data. They do not know the targets. They have no reference point for whether their store is performing well or poorly. And without that information, even well-intentioned employees have no basis to act differently.
This is not a motivation problem. It is a visibility and feedback problem.
Removing Excuses with Normalized Data
The first instinct when store-level performance data becomes visible is to explain the gaps away. A store in a warmer region will naturally consume more. A coastal location runs the AC harder. A high-footfall period skews the numbers.
Some of those explanations are legitimate. Most of them are not, or at least, not fully.
This is why normalization is a prerequisite for any performance comparison that is meant to drive accountability. Apollo adjusts for climate and seasonal load differences automatically across stores. The additional energy burden a warmer region genuinely imposes is calculated and removed from the comparison. What remains is the consumption that cannot be explained by location or season. That remainder is where inefficiency lives, and it is what gets flagged.
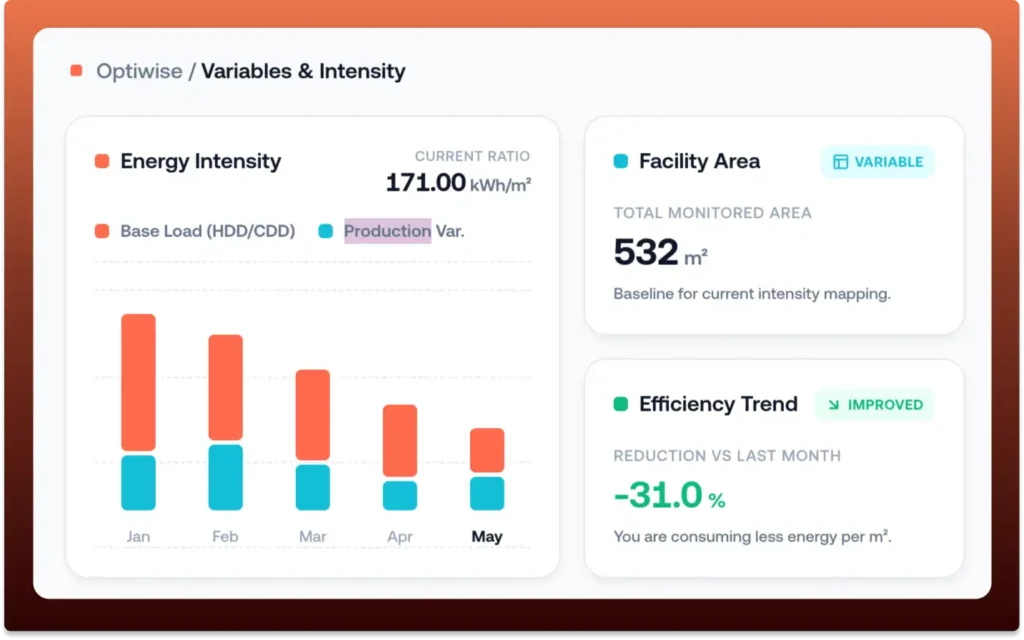
When a store manager sees that their consumption is elevated after climate adjustment, the “we’re in a hotter area” argument has already been accounted for. What is left is a real gap, and a real conversation.
The 3-Step Formula That Actually Changes Store Behavior
1. Real-Time Visibility at Store Level
Building energy awareness across a retail organization is not primarily a training exercise. A one-time onboarding module or an annual sustainability briefing does not change daily behavior. What changes behavior is continuous, relevant, and specific feedback tied to targets that people are actually held against.
2. Continuous Feedback Through Daily Operations
Store-level teams need to see their own store’s performance, not a company-wide average. They need to know the benchmark for their specific format, location type, and season. They need to understand how far above or below it they are sitting, and they need that information frequently enough to act on it before the month is already over.
3. Accountability Through Targets and Tasks
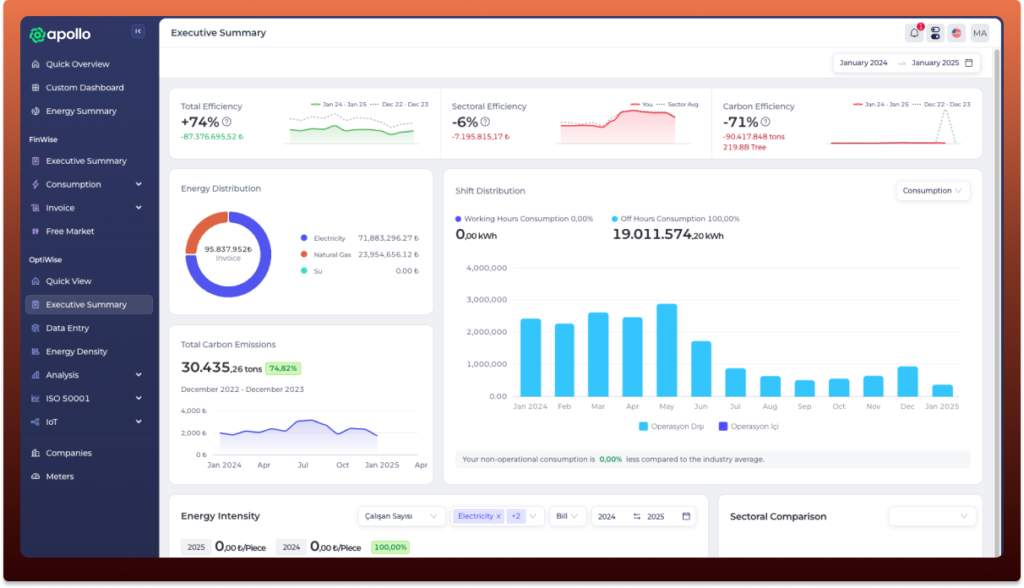
Apollo gives each store’s authorized users their own dedicated view. Store managers and staff see their daily consumption, their active tasks, their store’s current performance against target, and where they rank within the wider organization live, not in a monthly report. When an hourly or daily anomaly is detected, the system automatically opens a task and assigns a check. The feedback loop is continuous and operational, not retrospective and administrative.
This is the difference between energy as a compliance activity and energy as part of how the store is run. The first produces reports. The second produces results.
The Store Manager Effect and Why Rankings Make It Real
One pattern that emerges clearly across energy-conscious retail organizations is how much individual store manager behavior shapes outcomes. Managers who engage with energy data, who share targets with their teams, who treat anomalies as something to act on rather than explain away, consistently run more efficient stores than peers operating identical formats.
How Store Rankings Turn Performance into Action
What accelerates this effect is visibility into relative performance. When store managers and their teams can see how their store ranks against comparable locations across the network, something shifts. The comparison is no longer abstract. Underperformance is visible. Progress is visible. The gap between where a store sits and where the best-performing comparable store sits becomes a concrete, daily reference point.
This creates a natural dynamic that no training program can replicate. Stores compete. Teams engage. Incremental improvements accumulate. And because the benchmarks are properly normalized for climate and format, the ranking reflects actual operational performance, not structural advantages.
Making Projects Visible and Rewarding What Gets Done
Behavioral change accounts for a significant share of the savings potential. But targeted efficiency projects at individual facilities contribute the rest. Both need to be tracked, and both need to be visible across the organization for accountability to work at scale.
Apollo allows energy efficiency projects to be logged at the facility level. Pre- and post-implementation consumption periods are compared. Savings are calculated against each facility’s own unit price and consumption profile, so the ROI figure reflects real financial impact rather than a standardized assumption. Every project, across every facility, becomes part of a single organizational record of what has been done, what it delivered, and what the next opportunity is.
Linking Energy Savings to Real Financial Outcomes
This visibility is what makes reward mechanisms operationally meaningful. When a store manager completes a project that delivers measurable savings, that outcome is documented and attributable. Recognition, bonus structures, or store-level profitability targets can be tied directly to outcomes that are now verifiable. The result is that zero-capital behavioral and operational improvements become a recognized and rewarded part of how the organization runs, not an afterthought.
Proactive Energy Management: Acting Before the Month Ends
The final behavioral lever is financial. Energy budgets set at the start of the year are too often treated as fixed assumptions rather than active management tools. By the time a budget overrun is visible in a quarterly review, the operational window to respond has already closed.
Apollo allows monthly energy and water consumption budgets and targets to be defined at the facility level. Throughout the month, AI-driven forecasting draws on consumption trends, energy price movements, and climate data to project where each facility will land by month-end. Deviations are visible early, when there is still time to act.
This changes the nature of energy budget management from retrospective reconciliation to active course correction. Teams do not need to wait for the year-end report or the next bulk reporting cycle to know they are off track. They see it in time to do something about it.
The Shift That Unlocks 15% Savings
For a chain operating hundreds of stores, none of this is manageable without a platform that makes the feedback loop continuous and the comparison genuinely fair. The volume is too high, the variation too complex, and the data too fragmented to run on spreadsheets and monthly reviews.
What Apollo makes possible is the shift from energy as a central function to energy as distributed, daily accountability. Every store has its targets. Every anomaly generates a task. Every project is tracked. Every ranking is visible. And every budget has a forecast attached to it.
That shift, from reporting to operating, is where the behavioral savings actually live. Up to 15% of your total consumption is sitting in that gap right now. The stores already have everything they need to close it. What they are missing is the visibility to see it and the feedback loop to act on it consistently.
Conclusion: Behavior Is the Fastest Path to Energy Savings
The math is straightforward: if 25% of total energy cost reductions are achievable, and 60% of that comes from people; not equipment, then the fastest, lowest-cost path to energy performance is behavioral and operational.
But behavior only changes when three conditions are met:
- Visibility: Store teams need to see their own performance, properly normalized against their true peer group
- Relevance: They need continuous, real-time feedback, not monthly reports
- Accountability: Performance metrics need to be public, tracked, and tied to outcomes that matter
Most retail organizations have energy data. Many have employees who care about efficiency. What nearly all lack is the operational infrastructure to close the loop between data and daily action.
This is where the 15% lives.
You already know what Part 2 revealed: proper segmentation and benchmarking reveal where improvement is possible.
This part 3 reveals what actually drives improvement: the continuous feedback loop that turns visibility into accountability, and accountability into results.
Up to 15% of your energy savings is already within reach; hidden in daily store operations.